> ## Documentation Index
> Fetch the complete documentation index at: https://docs.altnautica.com/llms.txt
> Use this file to discover all available pages before exploring further.
# Diagnostics
> Live CPU, memory, disk, temperatures, and systemd service health.
# Diagnostics
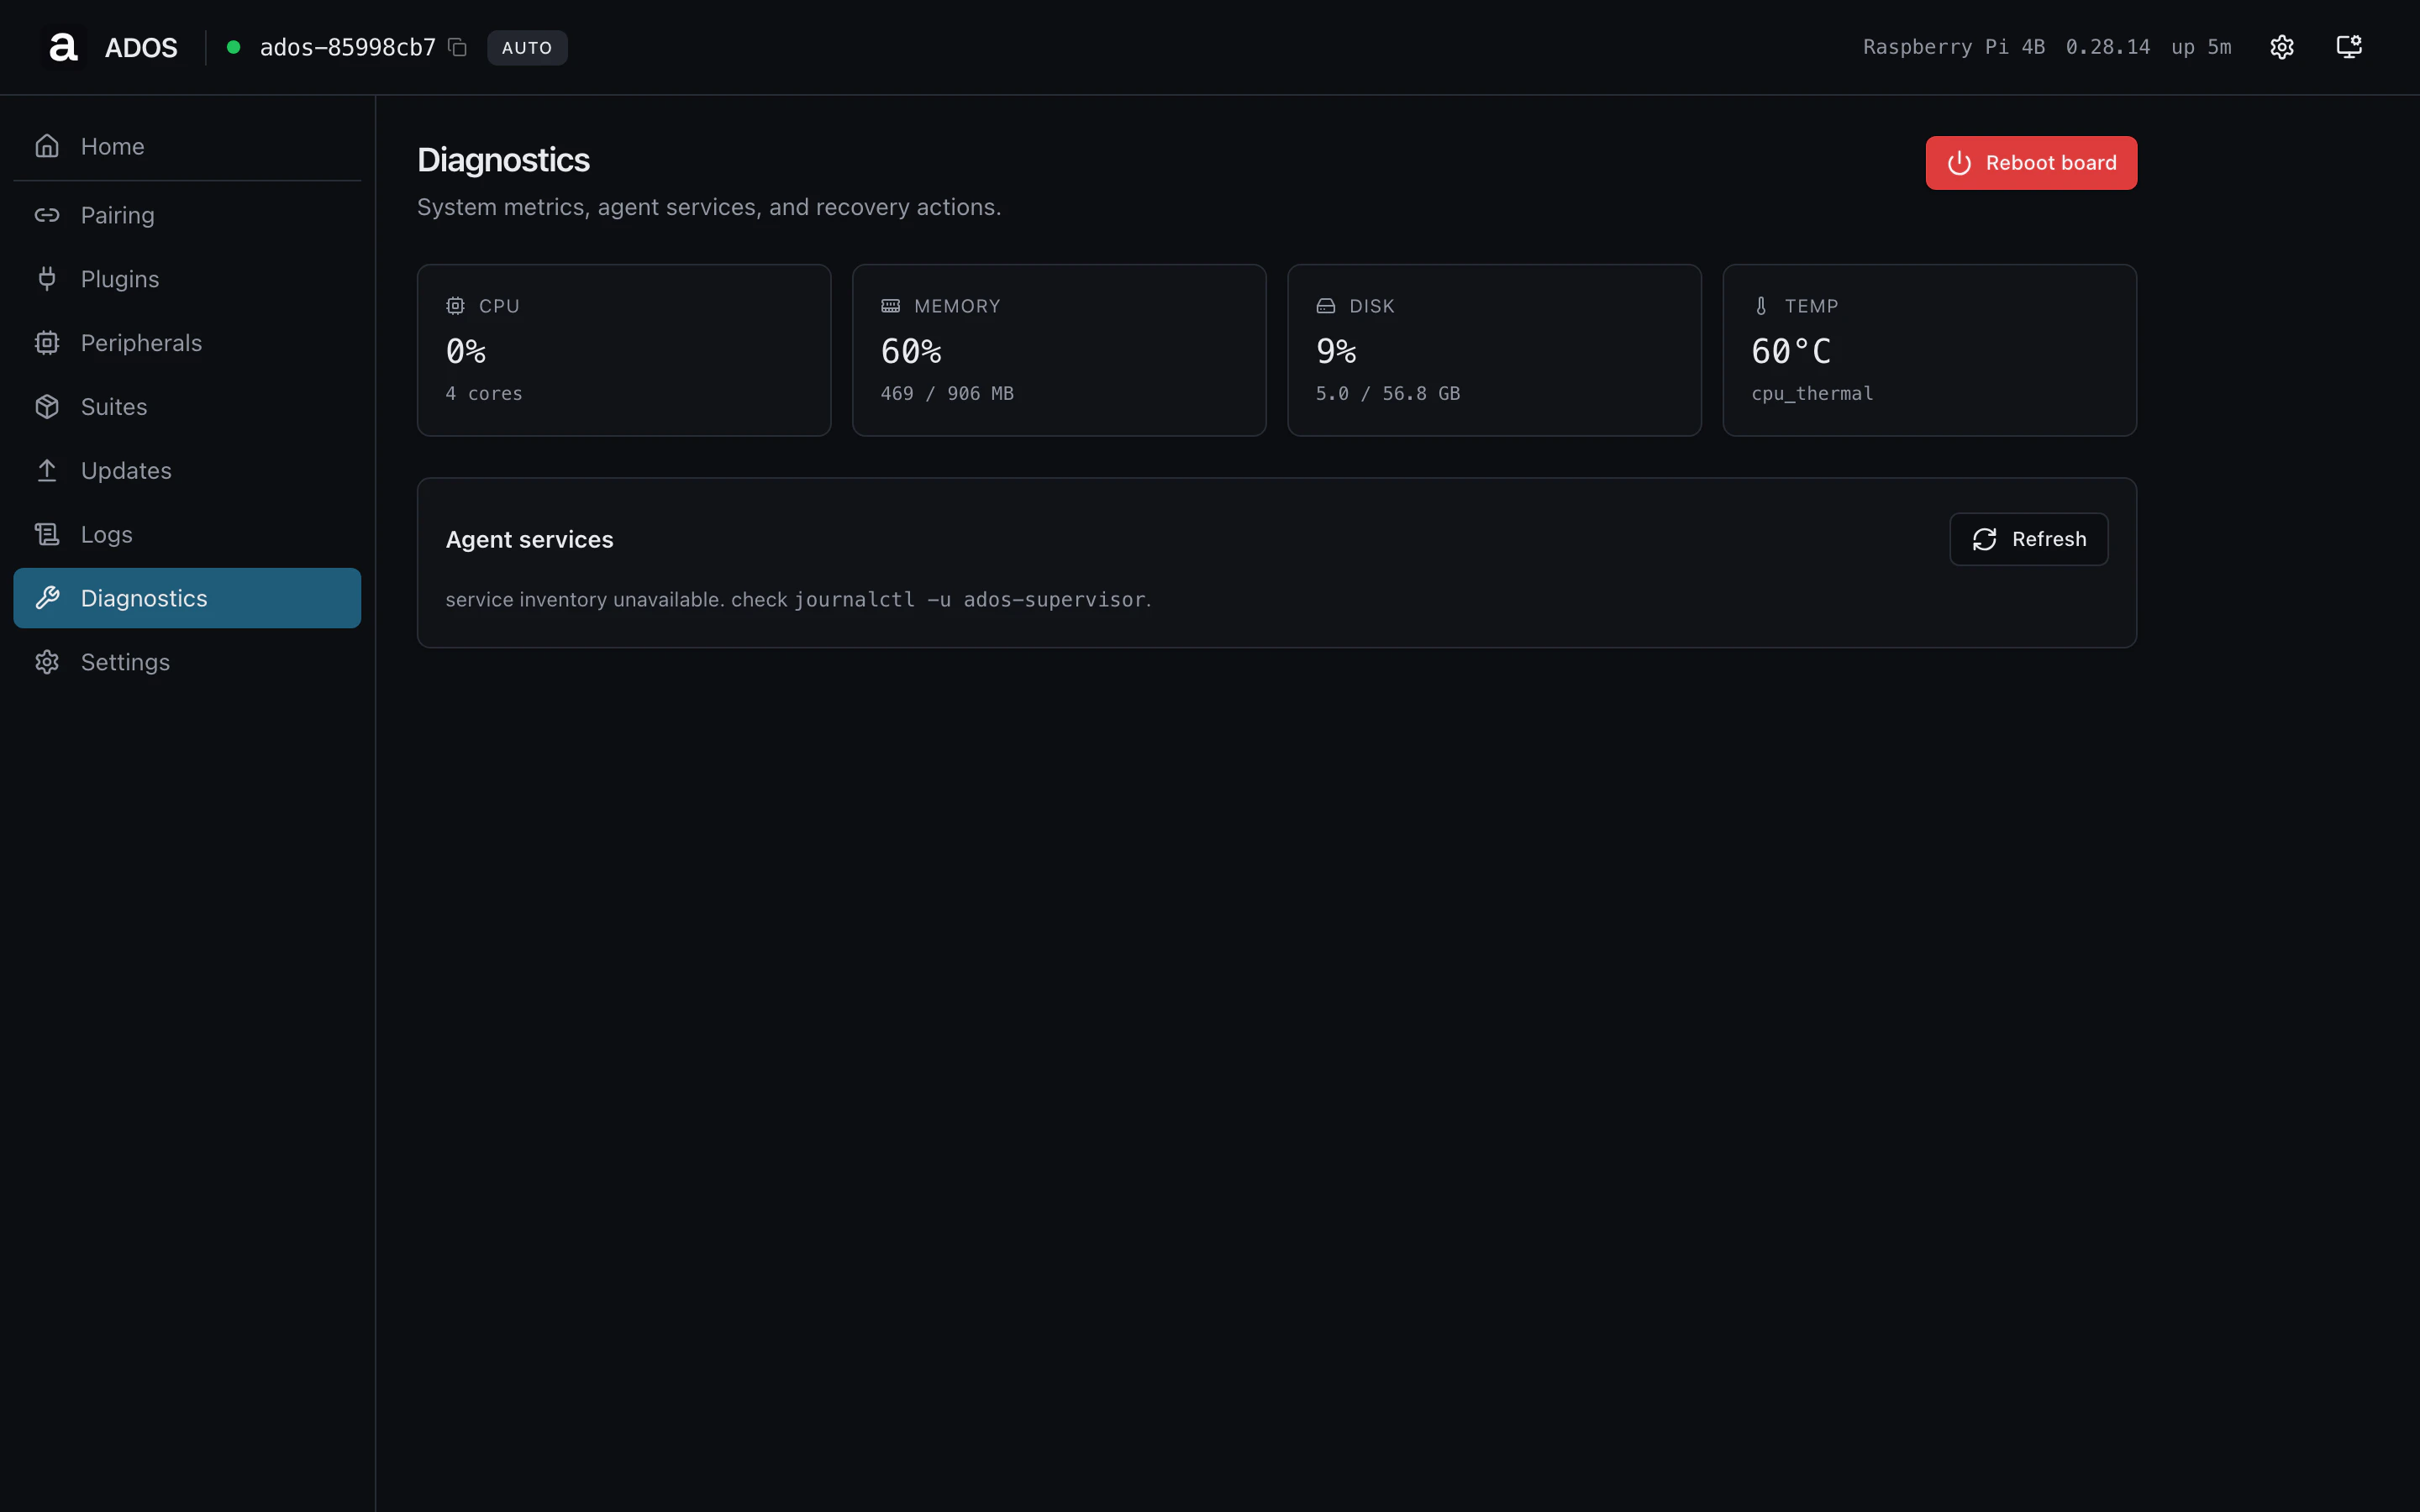
The Diagnostics page is the agent's system-health surface: hardware
utilization, temperatures, systemd unit state, and quick actions for
restart and reboot.
 ## System panel
CPU usage, core count, memory total / used / percent, disk total / used
/ percent, and the temperature sensors the kernel exposes
(`cpu_thermal`, SoC, board-level).
The page polls `/api/system` every five seconds.
## Control-plane latency
Mission Control measures the round-trip time of its control link to the agent
and shows it as `controlRttMs` on the drone card and the agent status card. It
is the time for a request to reach the agent and a response to come back, so it
reflects the path the GCS is actually using (LAN WebSocket, MQTT relay, or the
cloud poll), independent of the flight controller.
The agent answers a lightweight `GET /api/ping` echo for this measurement, and
the GCS also derives a value from its regular status poll, so a number shows up
without any extra configuration.
| Reading | What it means |
| -------------------- | -------------------------------------------------------------------------------------------------------------------------- |
| Tens of milliseconds | Direct LAN connection, healthy. |
| 100-300 ms | MQTT relay or a busy network. |
| Seconds | Cloud command-queue poll, or a degraded link. Manual control will feel laggy. Prefer a LAN connection for hands-on flying. |
A missing or steadily climbing value means the control path is unhealthy. Check
the connection method (LAN versus cloud) and the network between the GCS and the
agent.
## Services panel
Every systemd unit in the agent's set. Each row shows unit name,
active / inactive, sub-state (`running`, `dead`, `failed`), and PID.
### Per-service actions
| Action | Effect |
| ------- | ------------------------------------- |
| Restart | `systemctl restart` on the unit. |
| Stop | Stop without disabling. |
| Logs | Filter the Logs page to this service. |
### Reboot
A reboot button at the bottom of the page calls `/api/v1/setup/reboot`.
The reboot is graceful: the agent flushes state, stops services, and
schedules the reboot.
## Profile gating
Shared route, visible on both profiles.
## Backend endpoints
| Method | Path | Purpose |
| ------ | ------------------------------ | ---------------------------------------------------- |
| GET | `/api/system` | CPU / memory / disk / temps |
| GET | `/api/services` | Unit list |
| GET | `/api/ping` | Lightweight echo for control-plane round-trip timing |
| POST | `/api/services/{name}/restart` | Restart a unit |
| POST | `/api/v1/setup/reboot` | Reboot the node |
## Troubleshooting
The agent could not reach its own dbus connection to systemd. Run
`systemctl status ados-supervisor` over SSH. A typical cause is a
permission misconfiguration on the unit file.
Open the service's logs from the row action. The most common causes
are missing hardware (the service waits forever for a device), a
config typo (the service crashes on parse), or an upstream dependency
the service waits on. Restart with the dependency healthy.
## Related
* [Systemd services](/drone-agent/systemd-services)
* [Troubleshooting guide](/drone-agent/troubleshooting)
* [Logs page](/drone-agent/dashboard-logs)
## System panel
CPU usage, core count, memory total / used / percent, disk total / used
/ percent, and the temperature sensors the kernel exposes
(`cpu_thermal`, SoC, board-level).
The page polls `/api/system` every five seconds.
## Control-plane latency
Mission Control measures the round-trip time of its control link to the agent
and shows it as `controlRttMs` on the drone card and the agent status card. It
is the time for a request to reach the agent and a response to come back, so it
reflects the path the GCS is actually using (LAN WebSocket, MQTT relay, or the
cloud poll), independent of the flight controller.
The agent answers a lightweight `GET /api/ping` echo for this measurement, and
the GCS also derives a value from its regular status poll, so a number shows up
without any extra configuration.
| Reading | What it means |
| -------------------- | -------------------------------------------------------------------------------------------------------------------------- |
| Tens of milliseconds | Direct LAN connection, healthy. |
| 100-300 ms | MQTT relay or a busy network. |
| Seconds | Cloud command-queue poll, or a degraded link. Manual control will feel laggy. Prefer a LAN connection for hands-on flying. |
A missing or steadily climbing value means the control path is unhealthy. Check
the connection method (LAN versus cloud) and the network between the GCS and the
agent.
## Services panel
Every systemd unit in the agent's set. Each row shows unit name,
active / inactive, sub-state (`running`, `dead`, `failed`), and PID.
### Per-service actions
| Action | Effect |
| ------- | ------------------------------------- |
| Restart | `systemctl restart` on the unit. |
| Stop | Stop without disabling. |
| Logs | Filter the Logs page to this service. |
### Reboot
A reboot button at the bottom of the page calls `/api/v1/setup/reboot`.
The reboot is graceful: the agent flushes state, stops services, and
schedules the reboot.
## Profile gating
Shared route, visible on both profiles.
## Backend endpoints
| Method | Path | Purpose |
| ------ | ------------------------------ | ---------------------------------------------------- |
| GET | `/api/system` | CPU / memory / disk / temps |
| GET | `/api/services` | Unit list |
| GET | `/api/ping` | Lightweight echo for control-plane round-trip timing |
| POST | `/api/services/{name}/restart` | Restart a unit |
| POST | `/api/v1/setup/reboot` | Reboot the node |
## Troubleshooting
The agent could not reach its own dbus connection to systemd. Run
`systemctl status ados-supervisor` over SSH. A typical cause is a
permission misconfiguration on the unit file.
Open the service's logs from the row action. The most common causes
are missing hardware (the service waits forever for a device), a
config typo (the service crashes on parse), or an upstream dependency
the service waits on. Restart with the dependency healthy.
## Related
* [Systemd services](/drone-agent/systemd-services)
* [Troubleshooting guide](/drone-agent/troubleshooting)
* [Logs page](/drone-agent/dashboard-logs)