

8080. Port 8080 serves the live dashboard as soon as the agent is installed. / and /home both open Home. The pages it shows depend on the node’s profile (drone or ground station), and every page reads live data from the agent’s own REST API.
Open the dashboard
Use any of these addresses from a browser on the same network as the node:
A path that matches no page shows a not-found page with a link back to Home.
Access and authentication
Who can open the dashboard depends on where the browser is. A browser on the node itself is trusted. While the node is unpaired, a browser on its hotspot, USB link or a link-local address gets in directly, and a browser elsewhere on your LAN is asked for the dashboard PIN (4 to 12 digits; the first visitor sets it). Once the node is paired, an off-box browser needs the PIN or the pairing key. Callers from outside your networks are refused.Dashboard PIN
When the agent refuses the browser, the dashboard shows a PIN splash instead of the pages:- No PIN yet: “Set a PIN to unlock this dashboard from other devices on your network.” Enter the PIN twice and press Set PIN.
- PIN set: “Enter the PIN to unlock this dashboard.” Enter it and press Unlock.
- Too many wrong attempts: the splash counts down until this browser may try again. If wrong PINs pile up from many callers, the whole node locks (HTTP
423E_PIN_LOCKED) and the splash reads “Too many wrong PINs on this node; locked for N min. Clear it from the node console or with the pairing key.”
Scripts and other non-browser clients use the
X-ADOS-Key header instead of a PIN. See REST API for API authentication.Layout
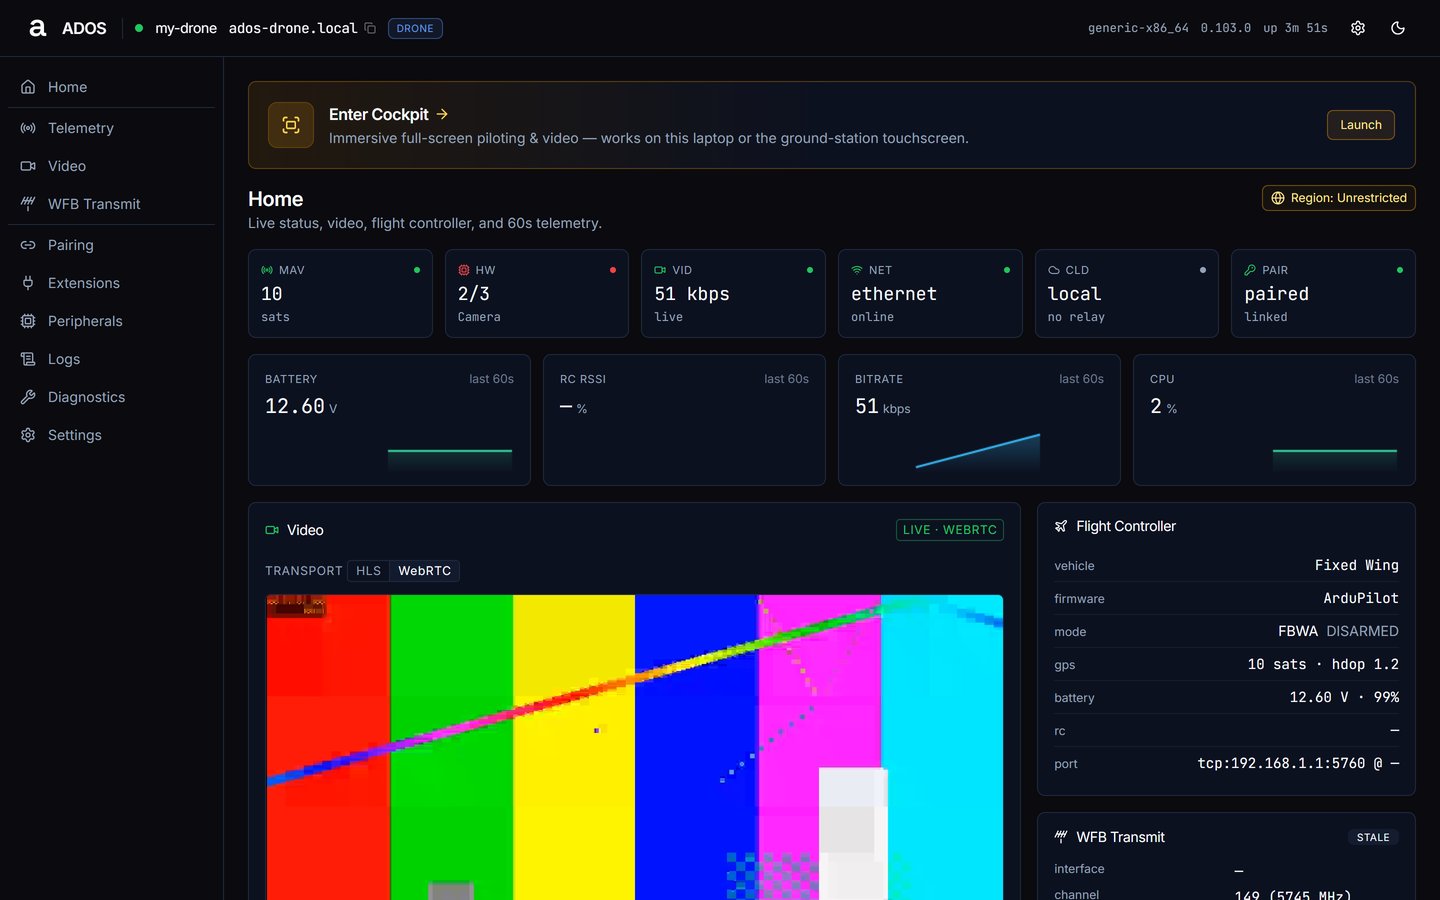
Home on a drone-profile node.
- Top bar: online dot, device name, the node’s .local name (click to copy), profile badge with ground role, board, agent version, uptime, a Settings shortcut and the theme toggle (dark, light, system).
- Sidebar: the pages for this profile (see the next section). Below the
lgwidth the sidebar becomes a drawer, and a bottom dock carries Home and Settings. - Enter Cockpit banner: on Home, opens the full-screen cockpit at
/cockpit. - Region chip: on Home, reads Region: Unrestricted or Region: Pinned to a country code, and opens Settings → Region.
- Banners: “Agent is unreachable. Reconnecting…” while the agent stops answering, and “Flight controller is disconnected.” on a drone with no FC link.
- Offline page: Home shows Agent unreachable when the agent’s REST API does not answer (check power, network and that
ados-supervisoris running), or Access not set up yet when the agent answered and declined; reload to set up access with the PIN.
What each profile shows
The sidebar and the routes follow the profile the agent reports throughGET /api/pairing/info:
- Shared: Home, Pairing, Extensions, Peripherals, Logs, Diagnostics, Settings.
- Drone adds: Telemetry, Video, WFB Transmit.
- Ground station adds: WFB Receive, Display & Joystick, Mesh (relay and receiver roles), Sources (receiver role).
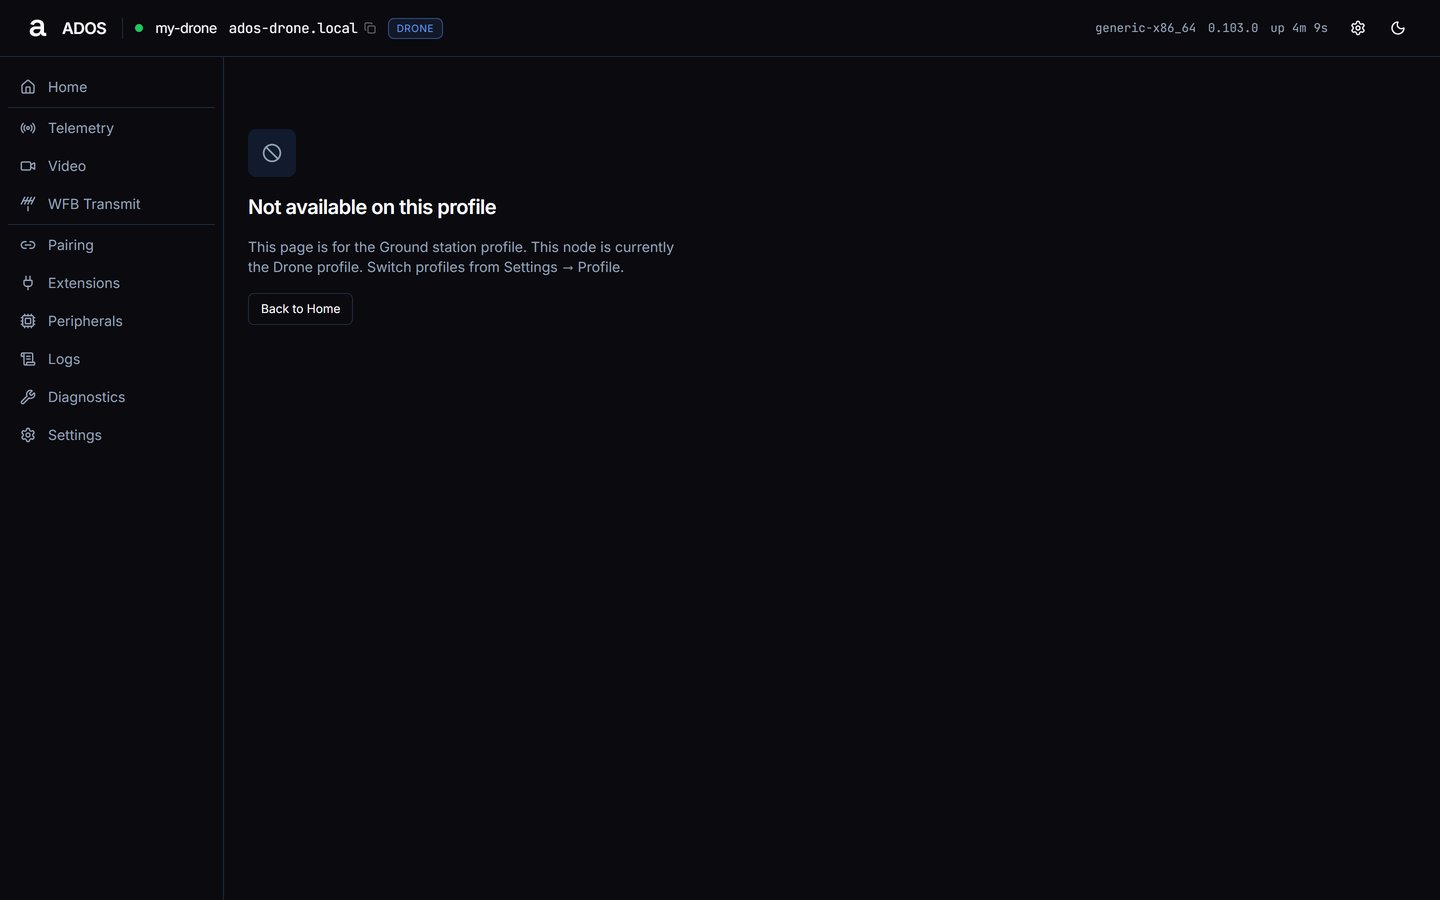
A ground-only route opened on a drone node.
Routes and profiles
The Profiles column lists where a route renders;n/a means every profile. Settings sections are filtered the same way.
To change the profile, open Settings → Profile, pick Drone or Ground station (and a role), keep Restart services after apply on, press Save profile and confirm. See Settings.
First-run setup
There is no separate setup web app. Onboarding lives in the CLI installer, and the dashboard is operational immediately after install. The agent still tracks setup progress as a step list, which Mission Control and scripts read fromGET /api/v1/setup/status:
Each step reports a state (
complete, needs_action or optional) and a detail line. On the dashboard, Home’s status tiles cover the same ground: a red HW tile names the missing required component.
Remote access through Cloudflare
The agent can run a remotely managed Cloudflare Tunnel. Install its token, or the install command Cloudflare gives you, through the setup API:GET /api/v1/setup/cloudflare/verify confirms the tunnel routes back to the agent.
Safety interlocks
While the vehicle is armed, the agent refuses actions that can drop the aircraft’s link or change how it flies, on the drone and ground station profiles. A vehicle state older than 3 seconds, or none at all, counts as armed. In the dashboard that covers:- parameter writes on Telemetry;
- Reboot board and restarts of link services on Diagnostics;
- profile, network, region and Wi-Fi changes in Settings;
- installing, enabling or disabling an extension, and peripheral actions.
409 with E_ARMED. Settings → Profile asks Vehicle is armed and offers Apply anyway; the other pages show the refusal and leave the action undone.
First five minutes
1
Check Home
Open Home. Check the six status tiles (MAV, HW, VID, NET, CLD, PAIR) and the 60-second charts below them (Battery, RC RSSI, Bitrate, CPU). A red HW tile names the failing required component; open the Hardware panel for the fix.
2
Pair with Mission Control
Local-only node (default): in Mission Control open Pair New Node and enter the node’s hostname or IP. Cloud-relay node: copy the six-character code from Pairing and enter it in Mission Control, or paste a code Mission Control shows into Accept from Mission Control. The PAIR tile reads paired once linked.
3
Set a dashboard PIN
Open the dashboard from another device on your LAN and set a PIN, so later visits from the LAN need it.
Next steps
Home
Status tiles, charts and panels on the landing page.
Ground dashboard
The ground-station pages.