

/diagnostics: system metrics, agent services, and recovery actions.
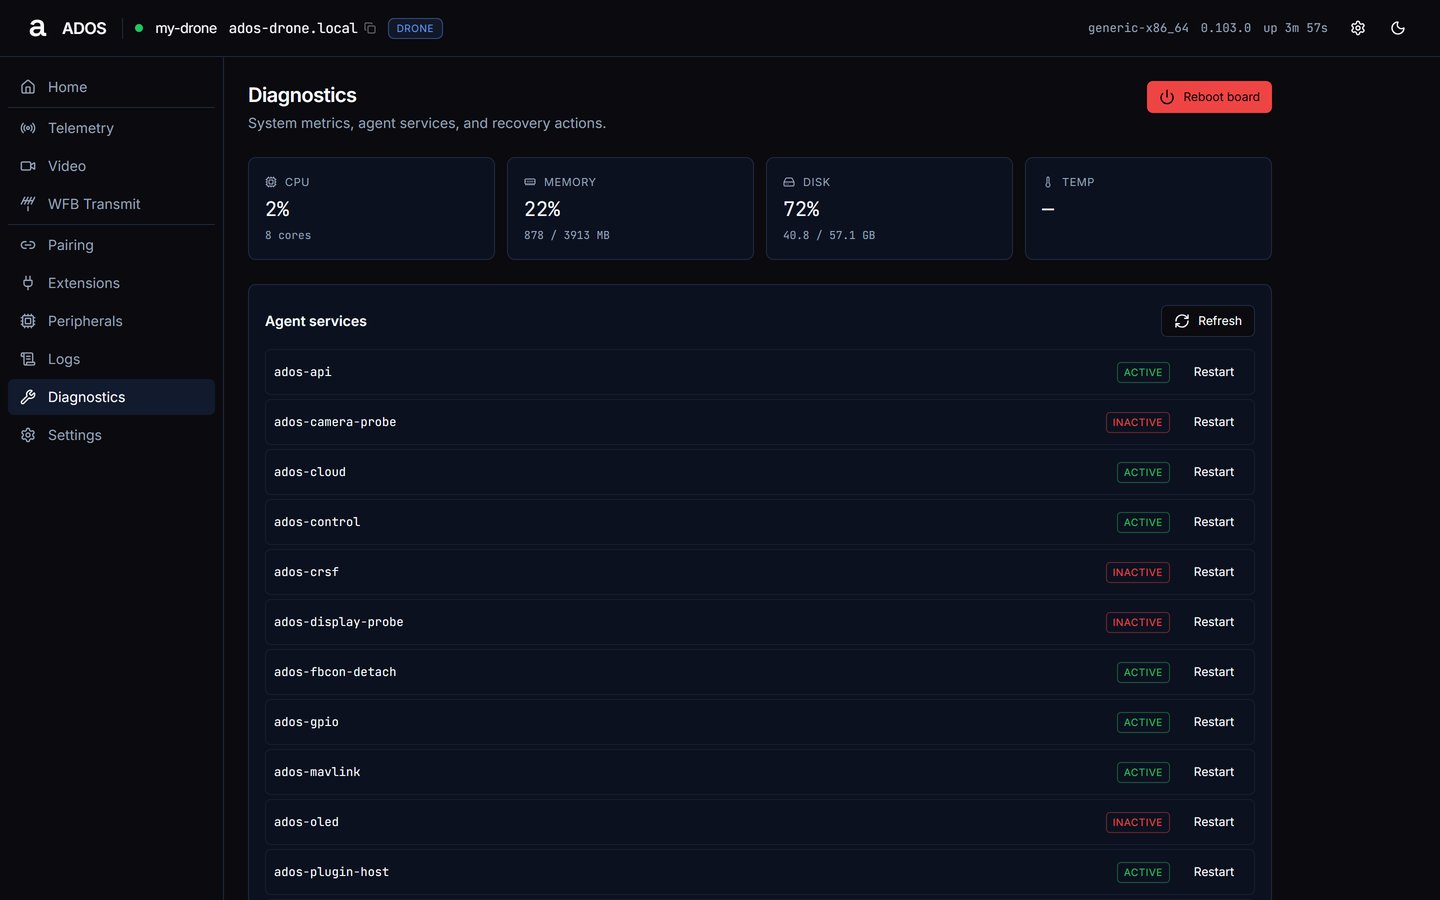
Diagnostics with the Agent services list populated.
System tiles
Agent services
Each row shows the unit name, its state badge and Restart. The confirm Restart<unit>? says “The service drops out and ados-supervisor brings it back. Dependent services may also restart.” Refresh reloads the list. The unit list itself is on systemd services.
Reboot board
Reboot board sits at the top right. The confirm Reboot the board? explains that the agent shuts down all services and asks the kernel to reboot; the dashboard reconnects once the board is back up (typically 30 to 60 seconds).Data sources
Troubleshooting
Couldn't reach the service inventory
Couldn't reach the service inventory
The agent did not answer
GET /api/services. Check journalctl -u ados-supervisor over SSH, then press Retry.Couldn't query systemd from the agent
Couldn't query systemd from the agent
systemctl is missing or blocked, so the inventory is unavailable; running services may still be alive. Check journalctl -u ados-supervisor.A service keeps failing
A service keeps failing
Filter the Logs page by its logger name, or read
journalctl -u <unit> over SSH.Next steps
Settings
Profile, network, cloud and security settings.
Agent diagnostics
The
ados diag harness and logs.