

/) is the main screen. The Fleet sidebar lists every node on the left. With no node selected, the main area shows one of four fleet views. Select a node and the main area becomes that node’s detail panel.
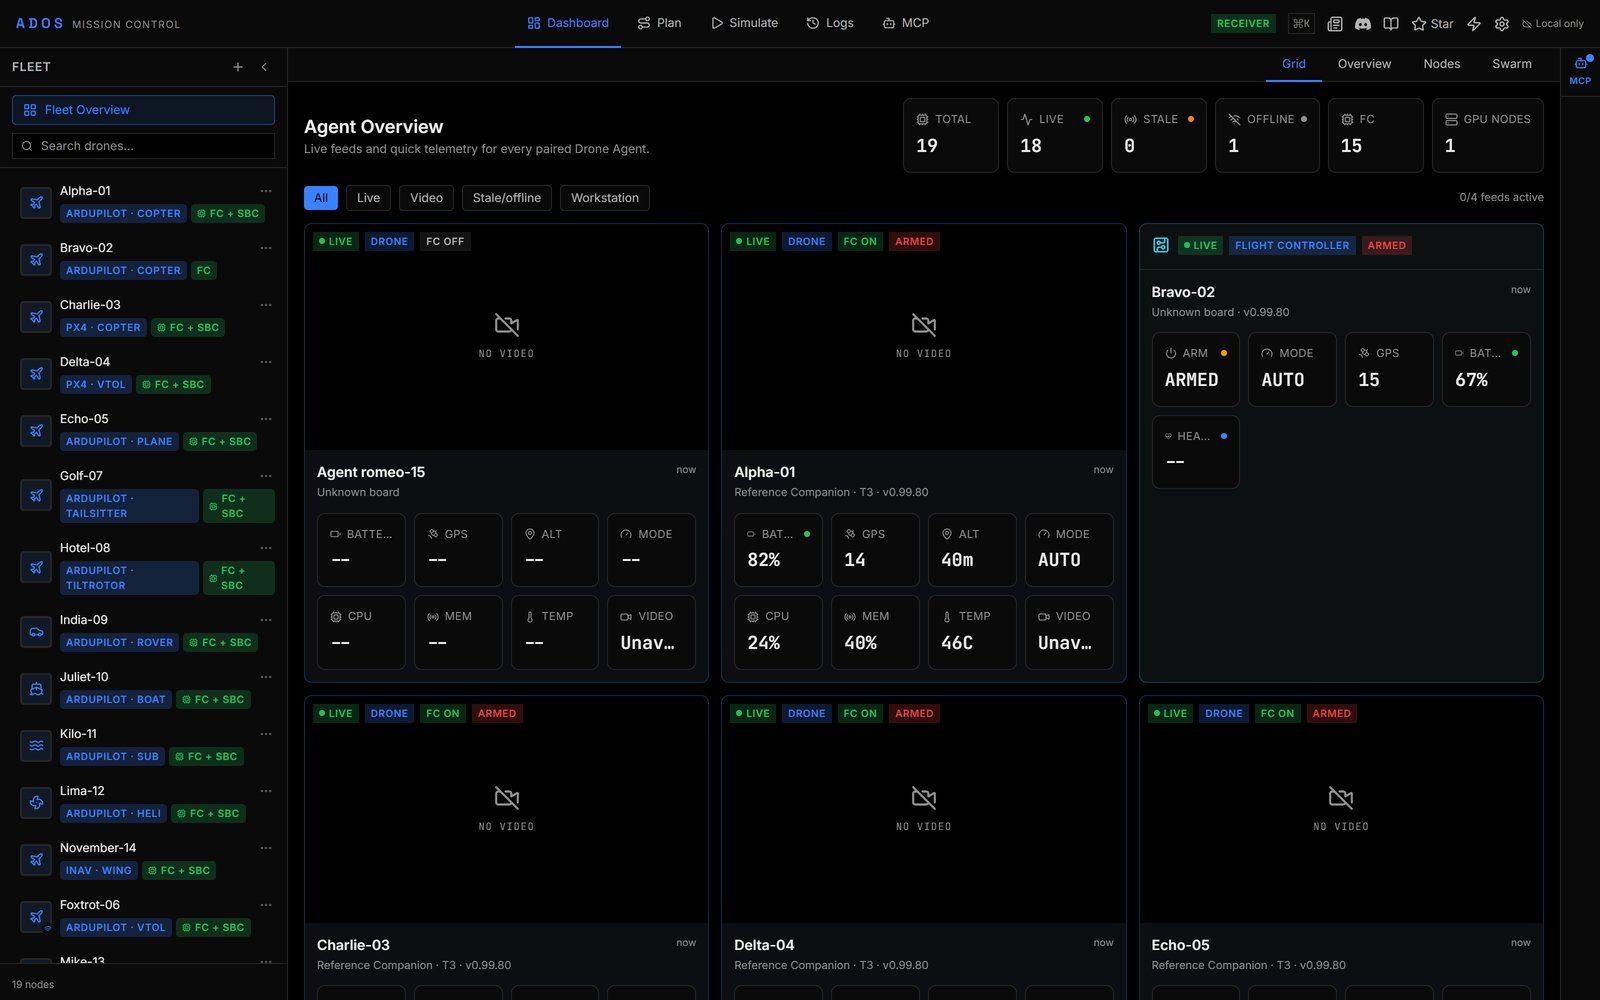
The Dashboard in Grid view (Agent Overview).
Top bar
The top navigation has five tabs:
The right side of the top bar holds, in order:
- The ground-station role (Direct, Relay, Receiver or Unset), when Mission Control is talking to a ground station.
- An alert count, when there are unacknowledged alerts.
- A ⌘K hint for the command palette.
- Community: the changelog, with a dot for unseen entries.
- Join Discord, Docs and Star on GitHub.
- Flash Tool (the lightning icon), which opens the Flash Tool.
- Settings (the gear), which opens Settings.
- Local only when you are not signed in (click it to sign in), or your account avatar when you are.
Command palette
Press Ctrl+K (⌘K on macOS) anywhere. The palette searches:- Navigation: Go to Dashboard, Mission Planner, Simulate, History (the Logs tab), MCP or Config, and Open Cockpit for a selected drone.
- Commands: Connect Drone, Return to Home All and Check Battery Status.
- Flight: the selected drone’s flight and safety Skills, such as Arm, Take Off, Land, Return to Home, Pause, Abort, Kill Motors and mode presets. They use the same confirmations as the cockpit.
- Parameters: type two or more characters while connected to jump to a parameter in the Parameters tab.
Fleet sidebar
The sidebar header reads Fleet, with + (Add drone) to open the Connect to Drone dialog and a chevron to collapse the panel. Fleet Overview clears the selection and returns to the fleet views. A search box filters by name or device id, and the footer counts nodes. Each row shows:- A type tile (Drone, Flight controller, Ground station or Workstation) whose ring shows health: steady when live, pulsing when stale, dimmed when offline. A small Wi-Fi mark means the node is on your LAN.
- The node name and a … actions menu (also on right-click).
- Up to three badges, for example the firmware and airframe (such as ArduPilot copter), FC + SBC or FC, Relayed, a ground-station role, or Stale and Offline.
Fleet views
With no node selected, a switcher picks the view. Grid is the default.Grid
The Agent Overview grid has one tile per node with live video where the node has it.- Stat tiles: Total, Live, Stale and Offline, plus Video, FC and GPU nodes when they apply.
- Filter chips: All, Live, Video, Stale/offline, and Workstation when workstations exist.
- Tiles: chips for liveness, node type, FC ON or FC OFF, and ARMED or DISARMED. Drone tiles show Battery, GPS, Alt, Mode, CPU, Mem, Temp and Video. Ground tiles show the role, link state and RSSI, SNR, Loss and Link. Workstation tiles show CPU, Mem, Disk and Temp.
Overview
A map beside four cards: Fleet Status, Active Missions, Fleet Battery and Alerts, followed by fleet telemetry, Recent Alerts and Quick Actions.Nodes and Swarm
Nodes is one console for the whole fleet: how each node is reached, relay streams, and per-node, bulk and fleet actions. Swarm shows one row per fleet slot from the swarm-bus beacons, with formation and bulk flight actions. Both are described on Nodes and Swarm views.Node detail
Select a node to open its detail panel. The header shows the node name, connection and authority chips, the device id, Delete, link and traffic indicators, and for a connected drone, Open cockpit (the monitor icon) and Reboot FC. Close it with X to return to the fleet views. Tabs are grouped under small labels. Extension tabs follow the built-in ones.- Drone
- Ground station
- Workstation
- Overview: node status, the Agent Status card and the video card.
- Flight: instruments, readouts, map and actions. See Flight tab.
- Cockpit: video, HUD and the Skill Bar. See Cockpit and Skills.
- Setup: flight controller panels. See FC configuration.
- Parameters: the full parameter list. See Parameters.
- Logs: flights and flight controller logs.
- Agent: the companion computer’s configuration. See Node configuration.
Agent Status card
The Agent Status card on a drone or ground station Overview shows CPU, memory, disk and temperature, the age of the last MAVLink heartbeat, and the control-plane round-trip time to the agent in milliseconds (hover title Control-plane round-trip time to the agent).
The round-trip time appears only while the node is live over a direct LAN link. Over the cloud relay, or before the first measurement, it is not shown. A node that stops answering shows Agent offline, and old data is marked Stale data with its age.
Demo fleet
In demo mode (npm run demo, ?demo=true, or Demo Mode in Settings → General) the fleet holds 19 nodes. Every vehicle-gated panel has a node to render on.
Each simulated vehicle generates telemetry with GPS noise, battery discharge and radio signal variation.
First run
On first launch a setup wizard asks for your language, shows the Before You Fly disclaimer (you must accept it to continue), then sets jurisdiction, units, demo mode, audio alerts, map position, operating region and theme. Re-run it from Settings → General → Re-run Setup Wizard. Until you sign in, a banner notes that your data is saved in this browser only.Route reference
Every Mission Control route
Every Mission Control route
Next steps
Nodes and Swarm views
Reach, relay streams and fleet-wide actions.
Cockpit and Skills
Fly with video, a HUD and bound Skills.
Flight tab
Instruments, map and the action panel.