What You Can Visualize
The simulation viewer renders multiple layers on the 3D globe:Replaying a Flight
1
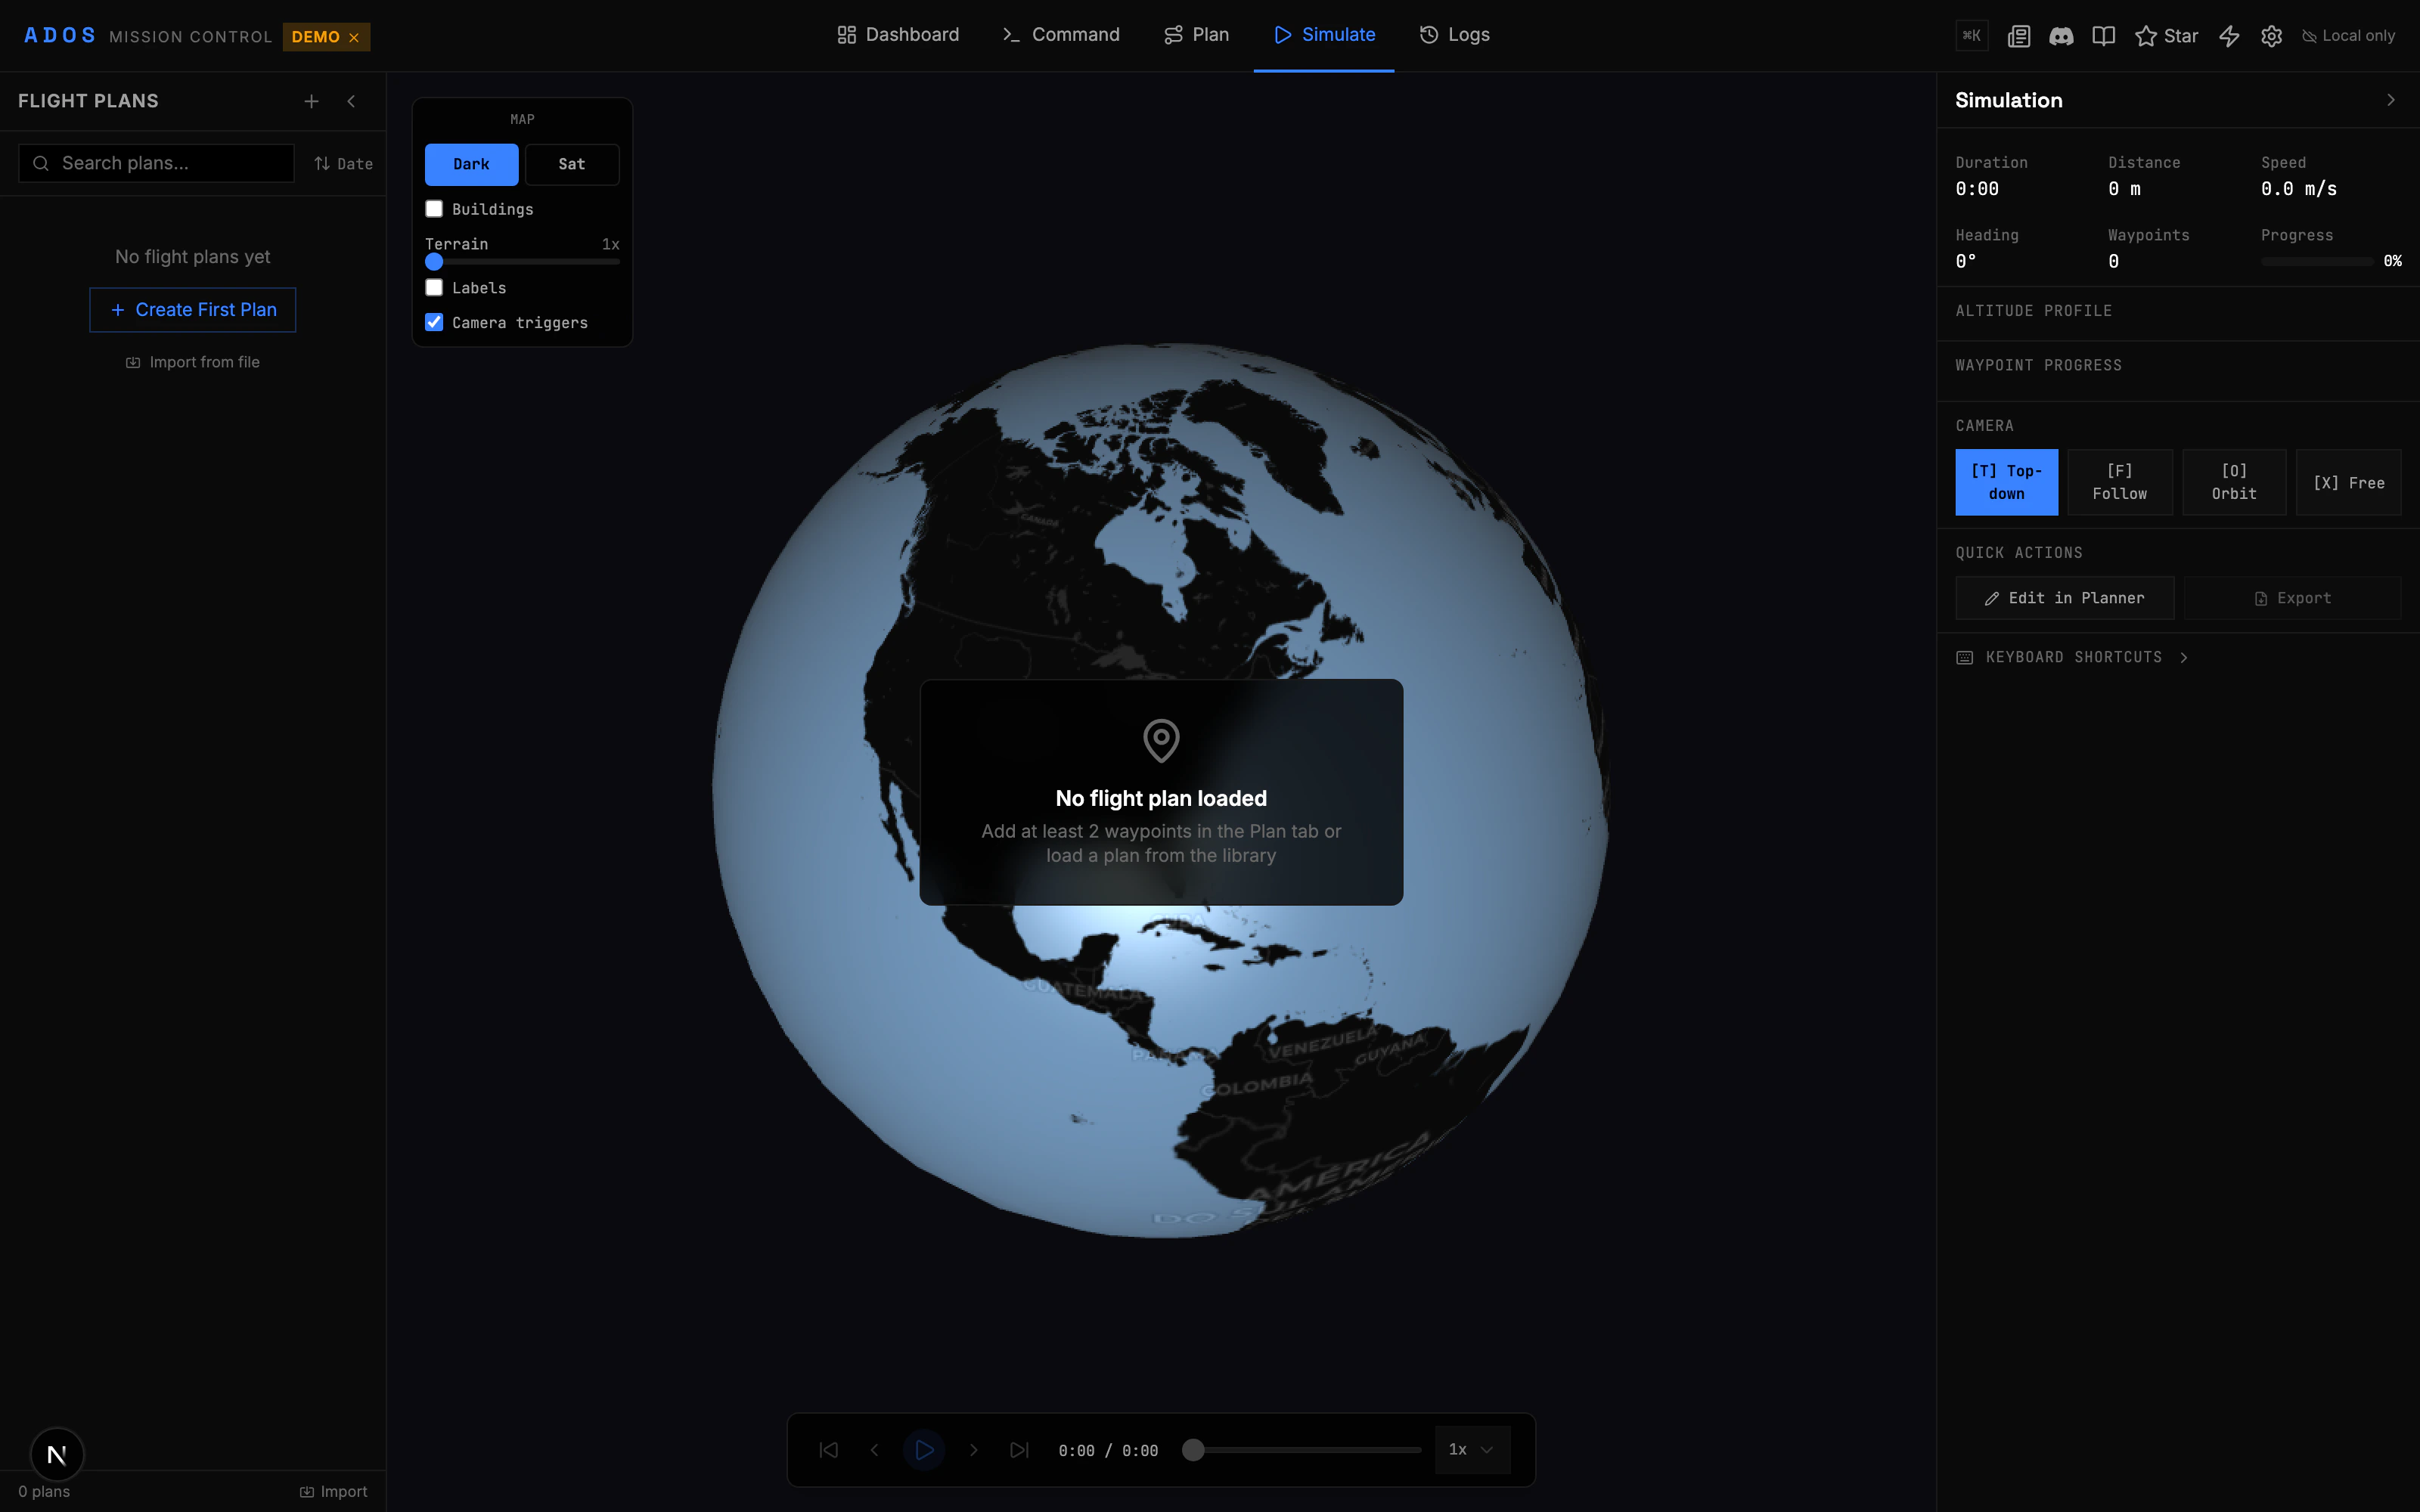
Open the Simulate tab
Click “Simulate” in the top navigation.
2
Load a flight
Select a flight from the left panel. This can be a saved mission or a recorded flight log from the History tab.
3
Use playback controls
The playback bar at the bottom controls the replay. Play, pause, scrub the timeline, or adjust playback speed.
4
Explore the 3D view
Rotate, zoom, and tilt the globe to view the flight from any angle. The camera can follow the drone or be positioned freely.
Playback Controls
The playback bar provides standard media controls:Simulation HUD
During playback, a heads-up display overlay shows real-time data at the current playback position:- Altitude (AGL and MSL)
- Ground speed
- Heading
- Battery level at that moment
- GPS status
- Distance from home
- Current waypoint (for mission replays)
Altitude Profile
Below the 3D view, an altitude profile chart shows:- Flight altitude over time or distance
- Ground elevation (terrain line)
- AGL clearance at each point
- Waypoint altitude targets vs actual altitude
Mission Preview
Before flying, you can preview a planned mission in 3D:- Plan a mission in the Plan tab.
- Switch to the Simulate tab.
- The planned mission renders as waypoints connected by path lines.
- Play the preview to see an animated drone fly the planned route.
Map Controls Panel
The controls panel on the side lets you toggle visualization layers:- Show/hide flight path
- Show/hide waypoint markers
- Show/hide camera triggers
- Show/hide geofence volumes
- Show/hide rally points
- Toggle terrain imagery (satellite, terrain, or both)
- Toggle 3D buildings (in supported areas)
Camera Modes
The CesiumJS viewer supports several camera modes:Cesium Token
CesiumJS requires an API token for terrain data and 3D tiles. Set theNEXT_PUBLIC_CESIUM_TOKEN environment variable with your Cesium ion token. Without a token, the globe still works but terrain elevation may be flat.
History Integration
The History tab records flight data. From the History tab, you can:- Select a recorded flight.
- Click “Open in Simulation” to load it in the 3D viewer.
- Replay the flight with full telemetry overlay.
Performance Notes
CesiumJS renders a full 3D globe with terrain and imagery. For best performance:- Use a dedicated GPU or integrated graphics with WebGL 2 support
- Close other GPU-heavy browser tabs
- Reduce the browser window size if frame rate drops
- On low-end machines, disable 3D buildings and use simplified terrain